Diagnostics screens give you easy access to view real-time diagnostics of the Register. If the printer is available, the you can print a diagnostic ticket. These screens present important system information, as well as on screen visual indications for register state, inputs, outputs and board/sensor status. The diagnostic mode also provides access to the comprehensive list of message data logs that are available in the Register.
Access Restrictions to Diagnostics Screens
User entry into the Diagnostics screens can be restricted either in the Security menu or by establishing a Maintenance Key.
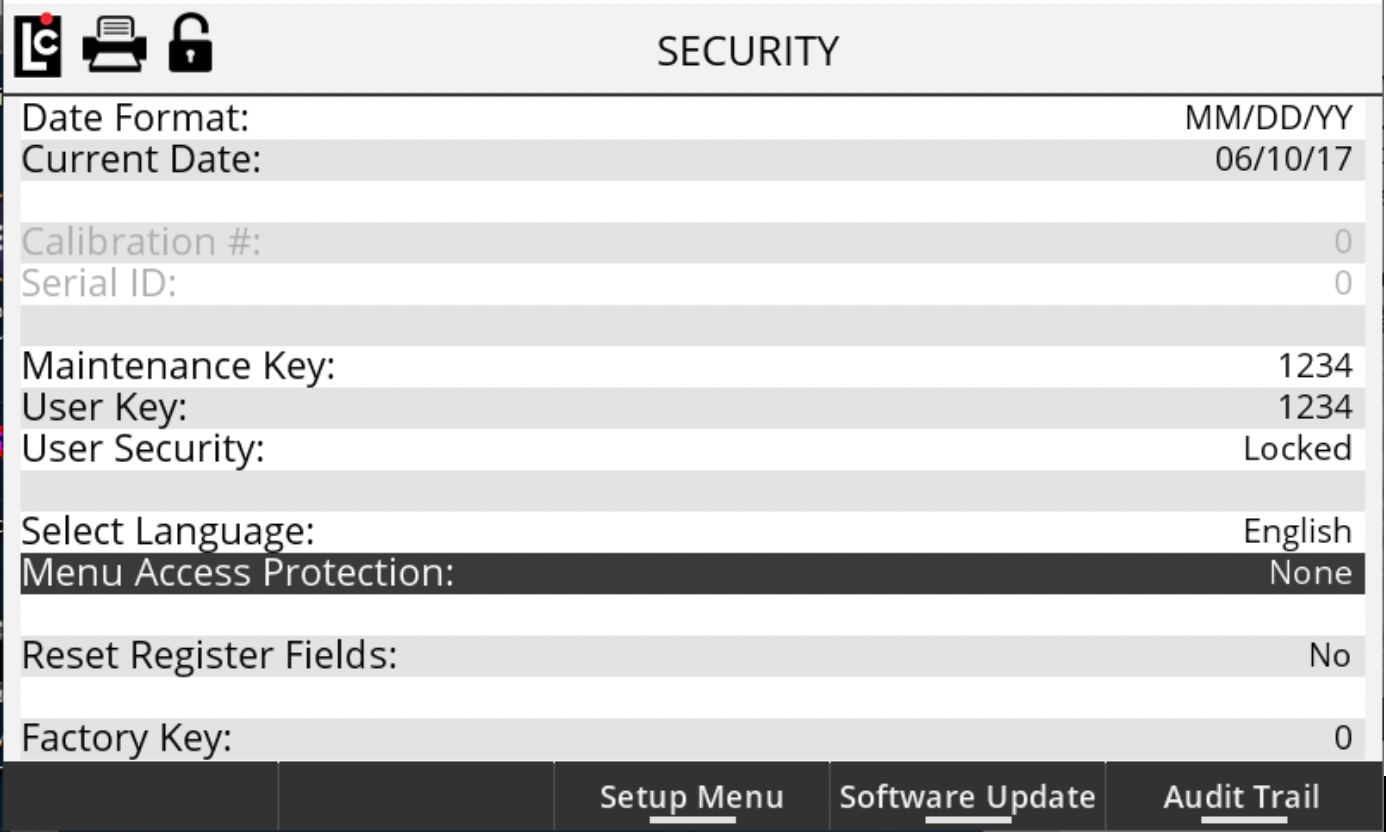
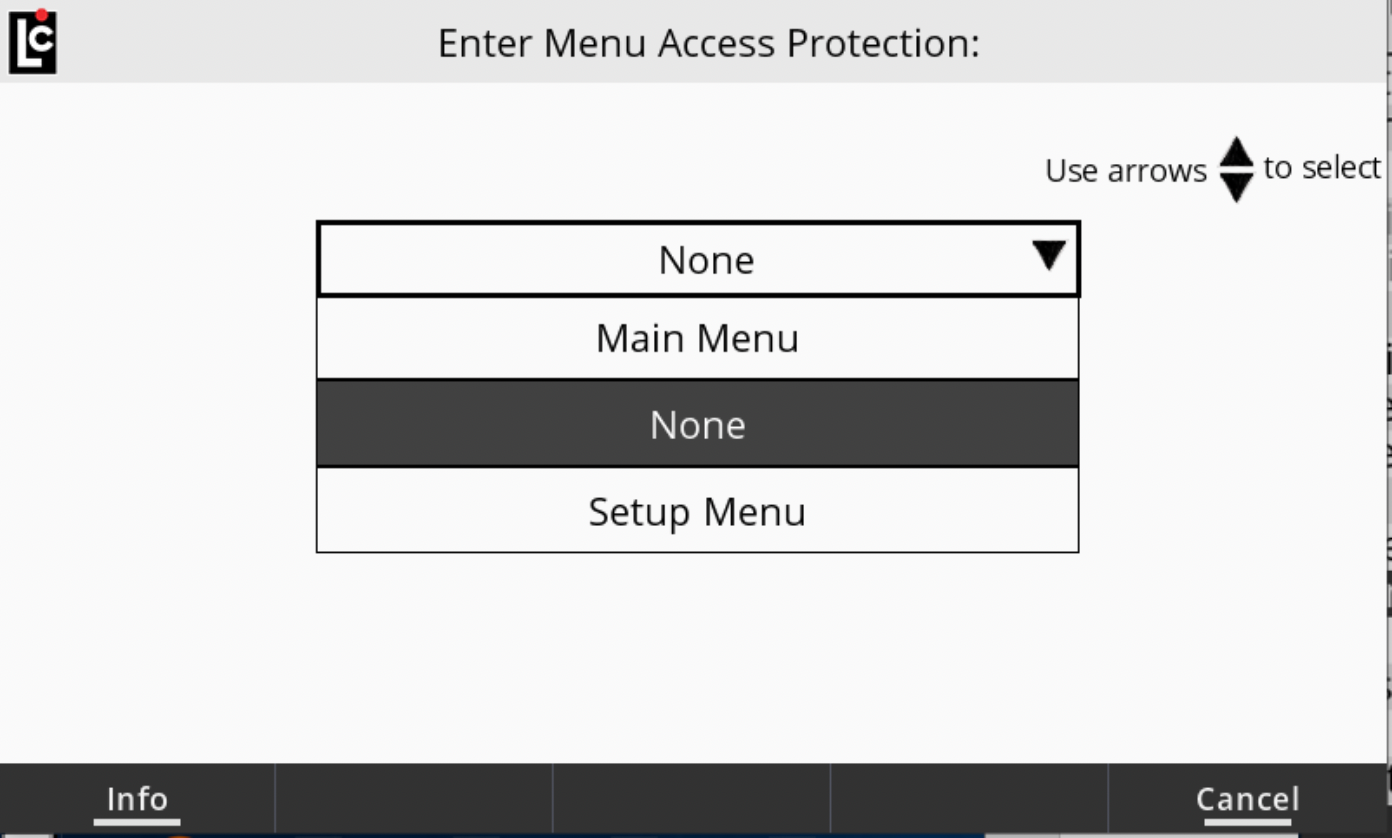
Restricting access in the Security menu
Entry to the Main menu, Setup menu, or Diagnostics Menu can be controlled by selecting one of those options from the Security menu and choosing a valid User Key value.
Restrict with a Maintenance Key
Entry into the Diagnostics screen from the Active Delivery screen will be restricted if a valid Maintenance Key has been set. As shown below, the user will be prompted to enter the Maintenance Key if they select the F2 to enter the Diagnostics screen.

Diagnostics Screen 1/7
A number of diagnostic values appear on screen 1/7:
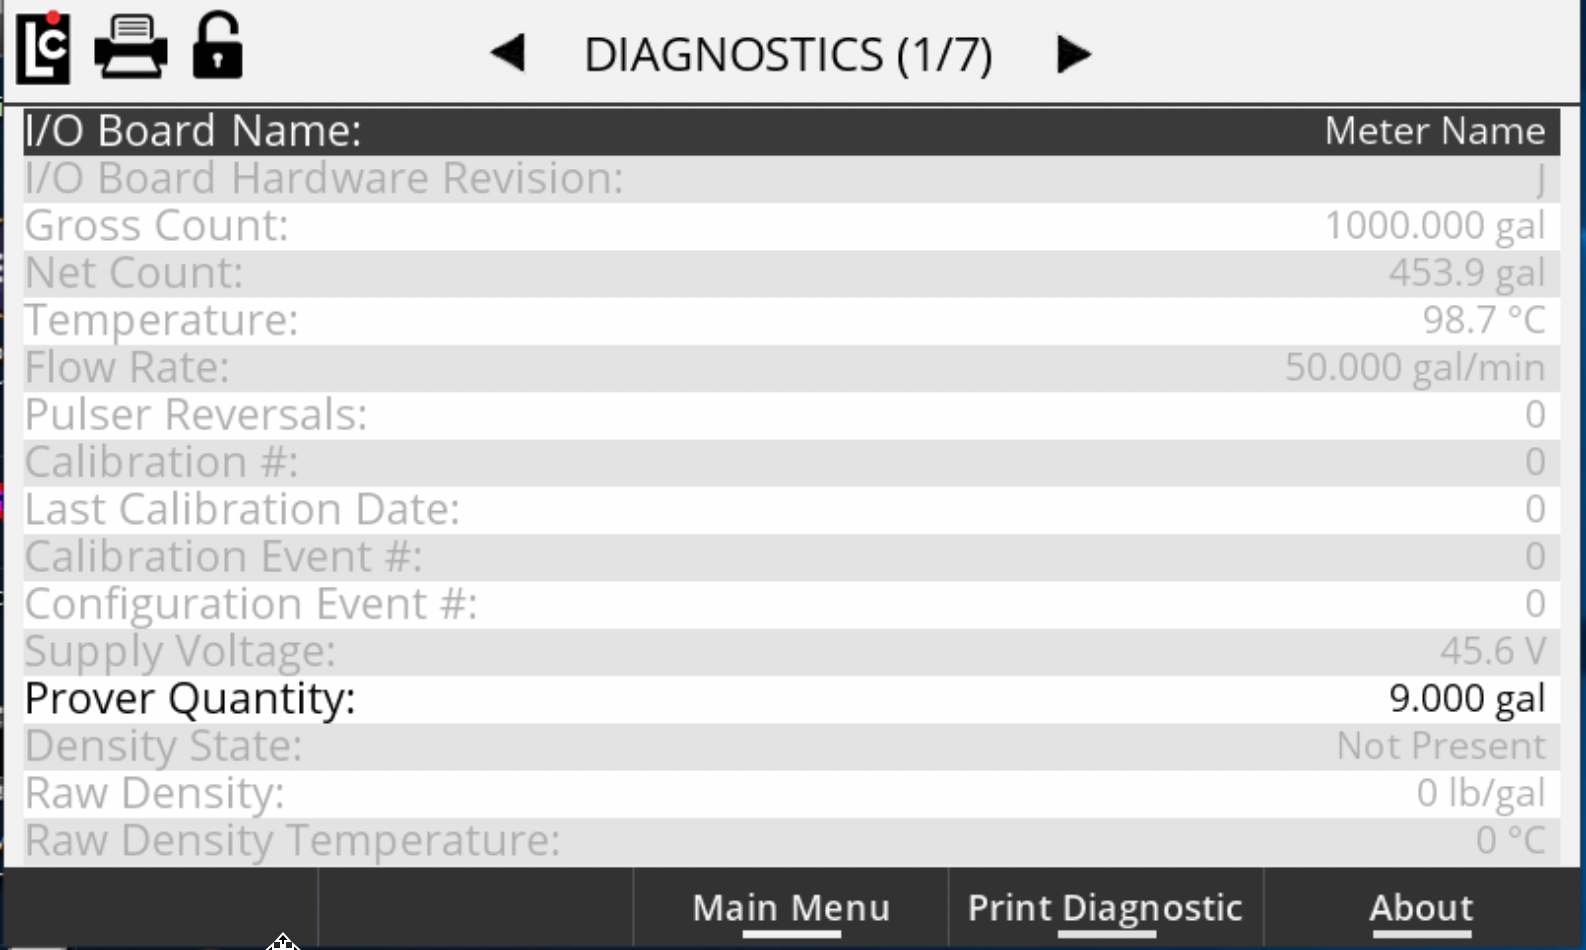
I/O Board Name – A text field that identifies the currently selected I/O board in the I/O board # field. The name will also appear on other screens to clearly identify the selected board. (Maximum - 16 Characters).
I/O Board Hardware Revision – Board Revision Level.
Gross Count – A read-only field showing the current gross delivery volume displayed on the Register.
Net Count – A read-only field showing the current net delivery volume displayed on the Register.
Flow Rate – A read-only field showing the current flow rate registered by Register during a delivery.
Pulser Reversals – A read-only field that accounts for any quadrature pulser faults registered by the Register during a delivery.
Calibration # – A read-only counter that increments one number each time the Register enters the calibration mode. This field is for metrological and troubleshooting use only.
Last Calibration Date – A read-only field displaying the last date and time the Register entered into the calibration mode.
Calibration Event # – A read-only counter that increments one number each time the Register enters the calibration mode and a calibration change is made. This field only increments one time per entry into calibration even if multiple changes are made. This field is for metrological and troubleshooting use only.
Configuration Event # – A read-only counter that increments one number each time (a) the Register enters the calibration mode and (b) a configuration field changes. This field only increments one time per entry into calibration even if multiple changes are made. This field is for metrological and troubleshooting use only.
Supply Voltage – Current voltage reading of the power supply.
Prover Quantity - The prover quantity for calibrating the meter.
Density State – Indicates if the product density feature is present or not.
Raw Density – Current or last reading of Density (if present).
Density Temperature – Current or last Density reading of product temperature (if present).
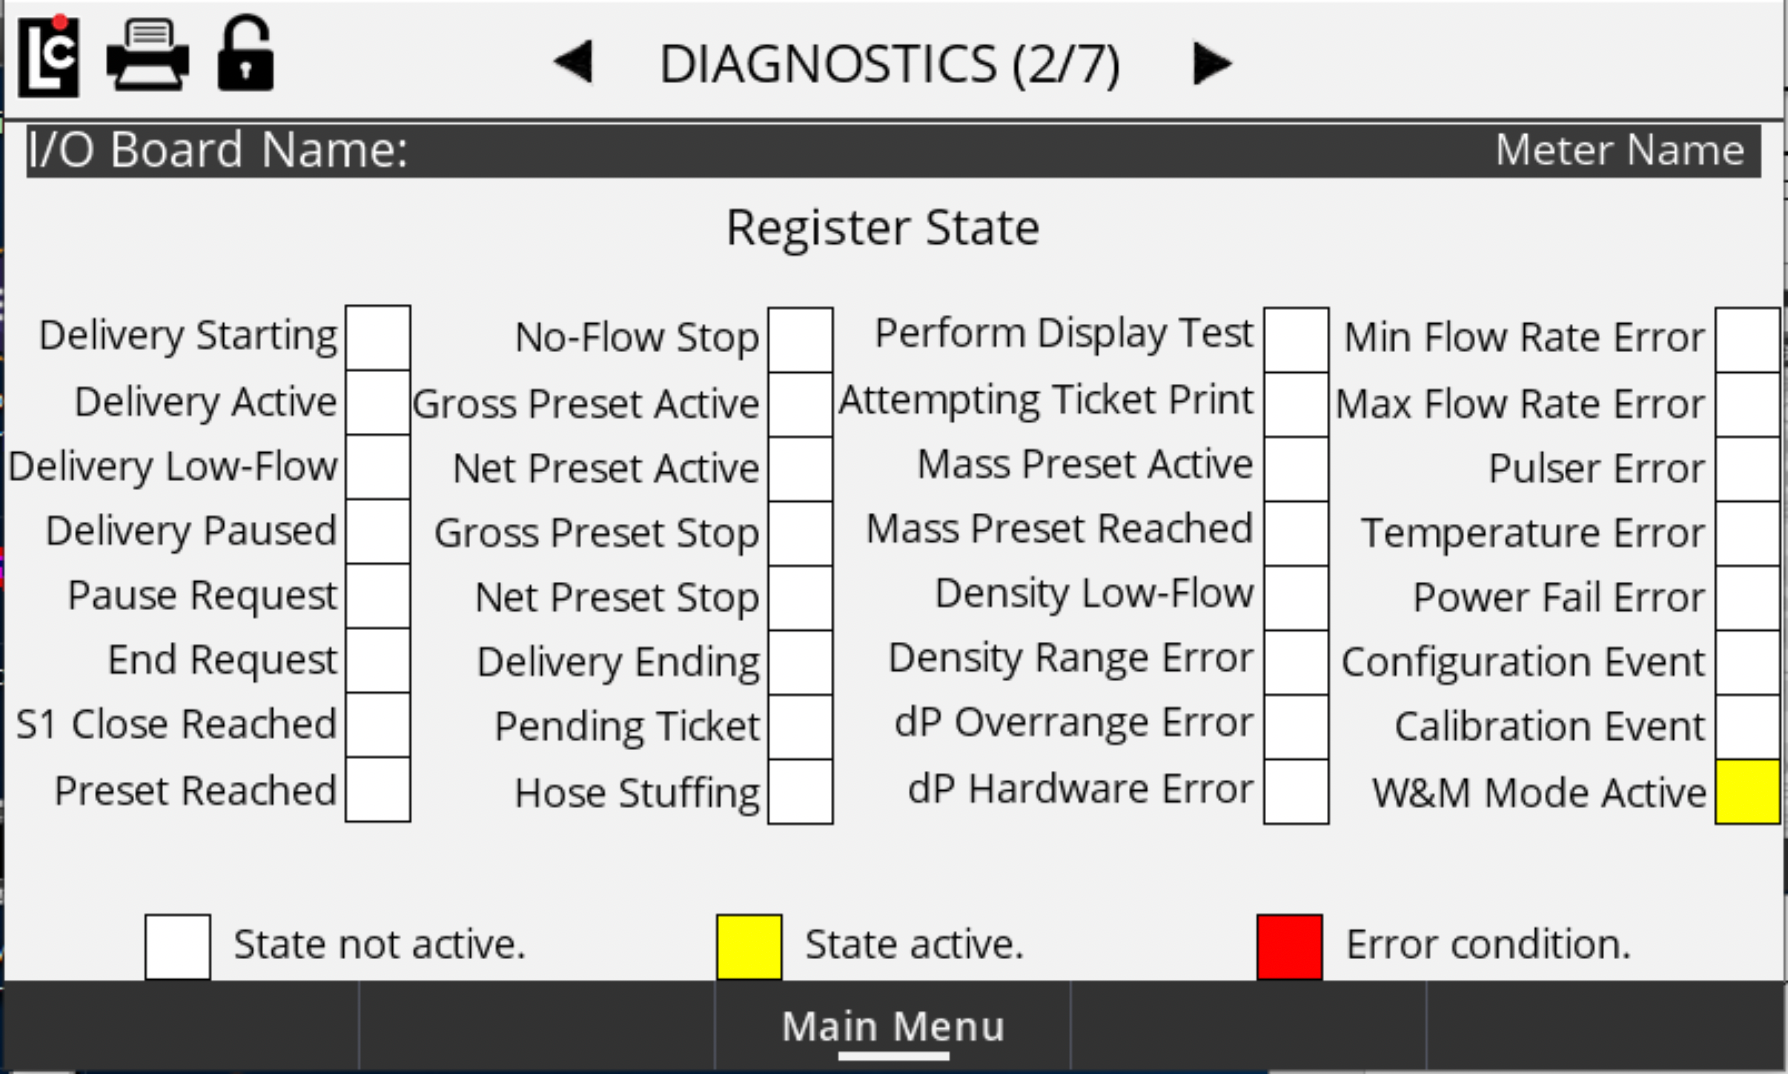
Diagnostics Screen 2/7
Register State – a real-time view of the current status of the key Register state fields. This is useful to see if a parameter is active (Yellow), not active (White), or in an error state (Red).
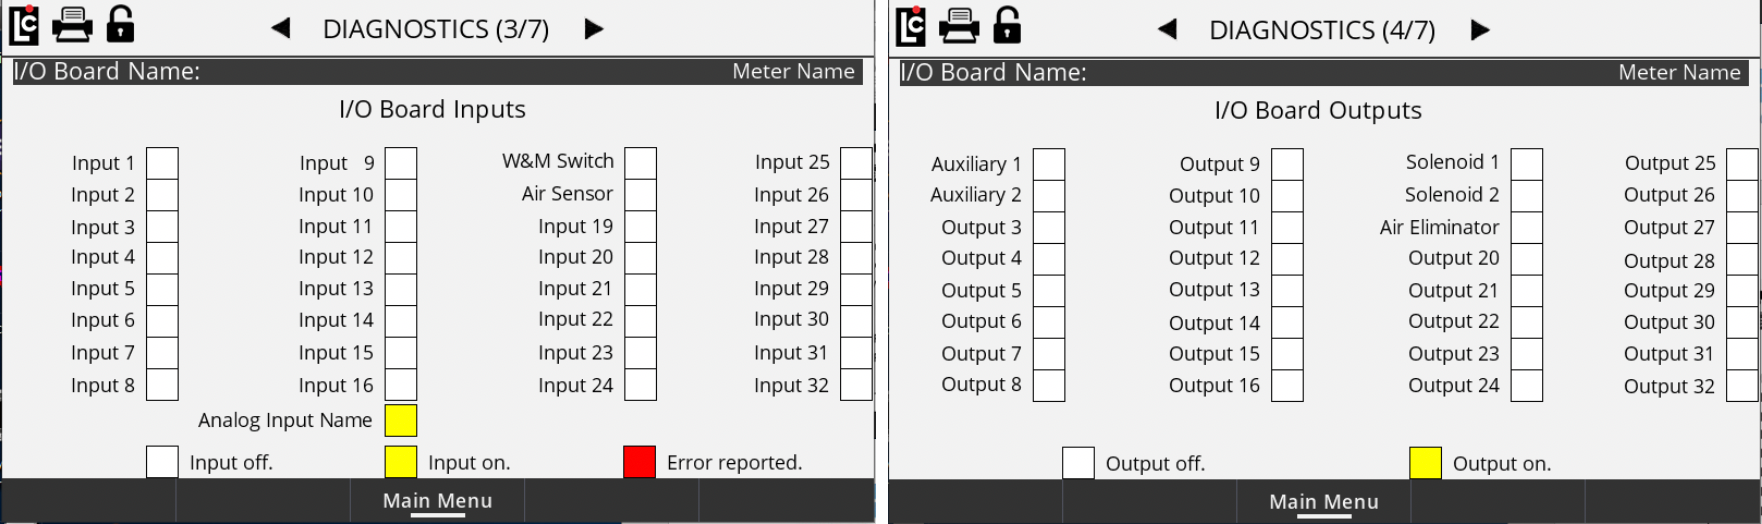
Diagnostics Screens 3/7 and 4/7
I/O Board inputs and outputs appear on screens 3/7 and 4/7. These provide a real-time view of the current status of Register I/O board digital inputs and outputs. These are useful in monitoring inputs and outputs that may have a status of on (Yellow), off (White), or error (Red).
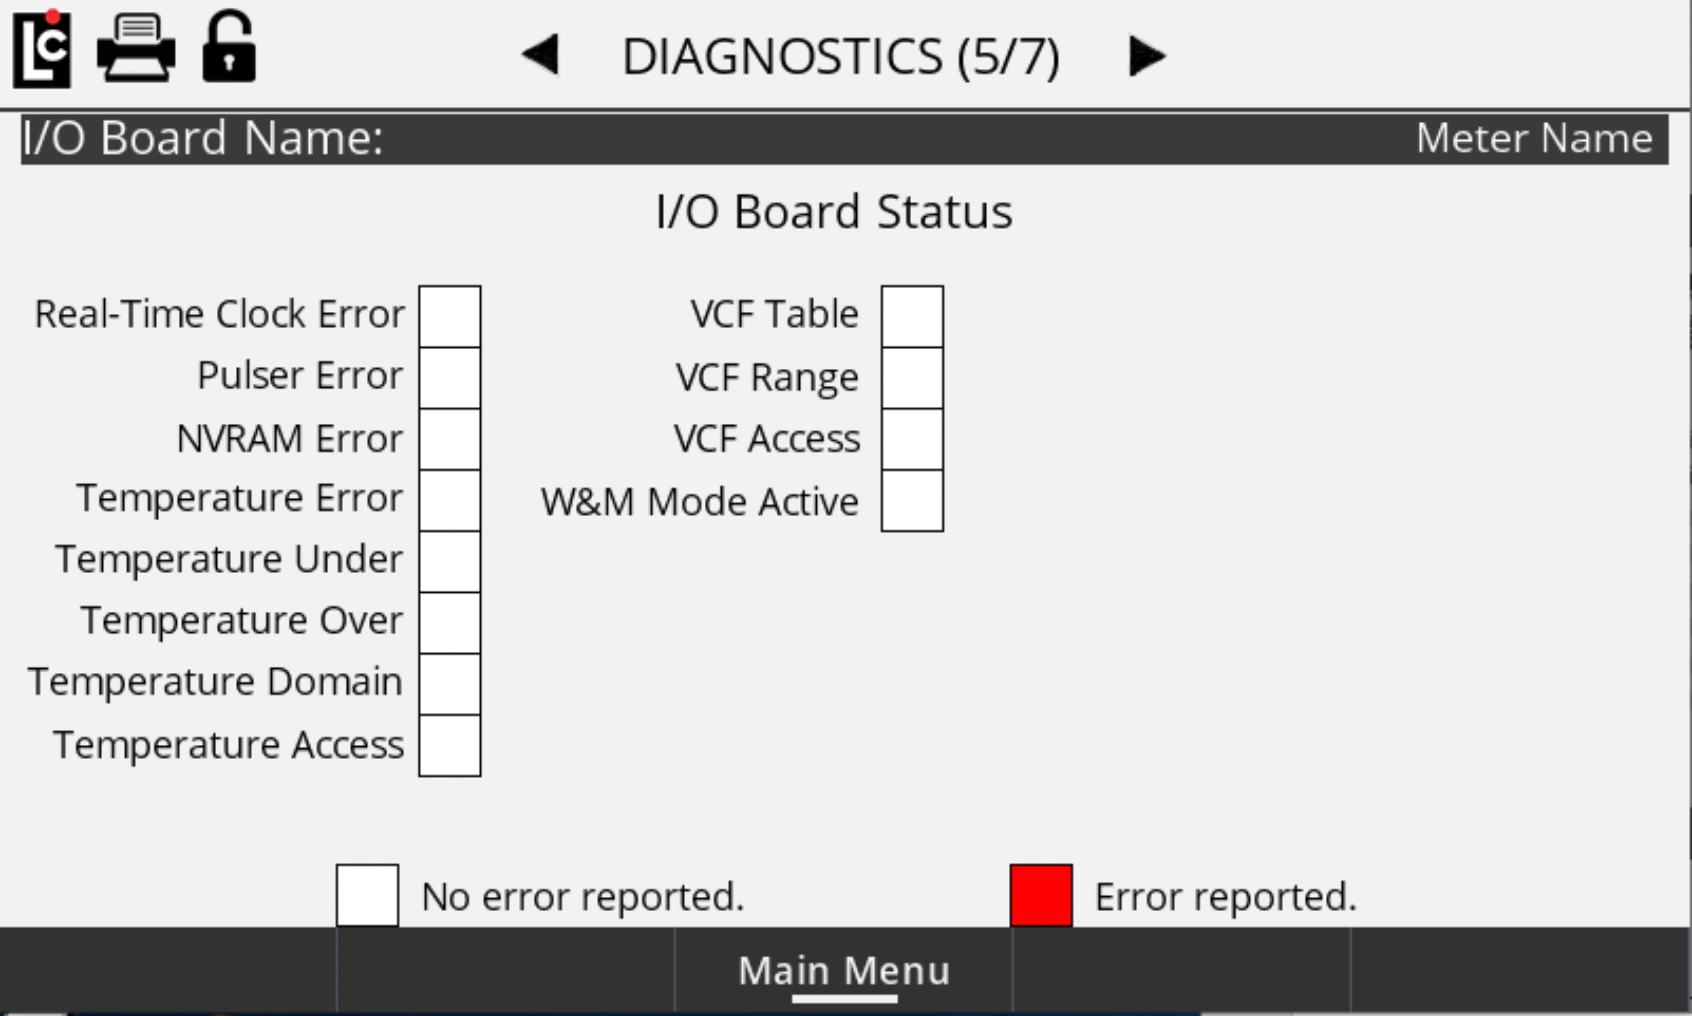
Diagnostics Screen 5/7
Potential error conditions are shown on Diagnostics Screen 5/67 The status will be either off (White) or error (Red).
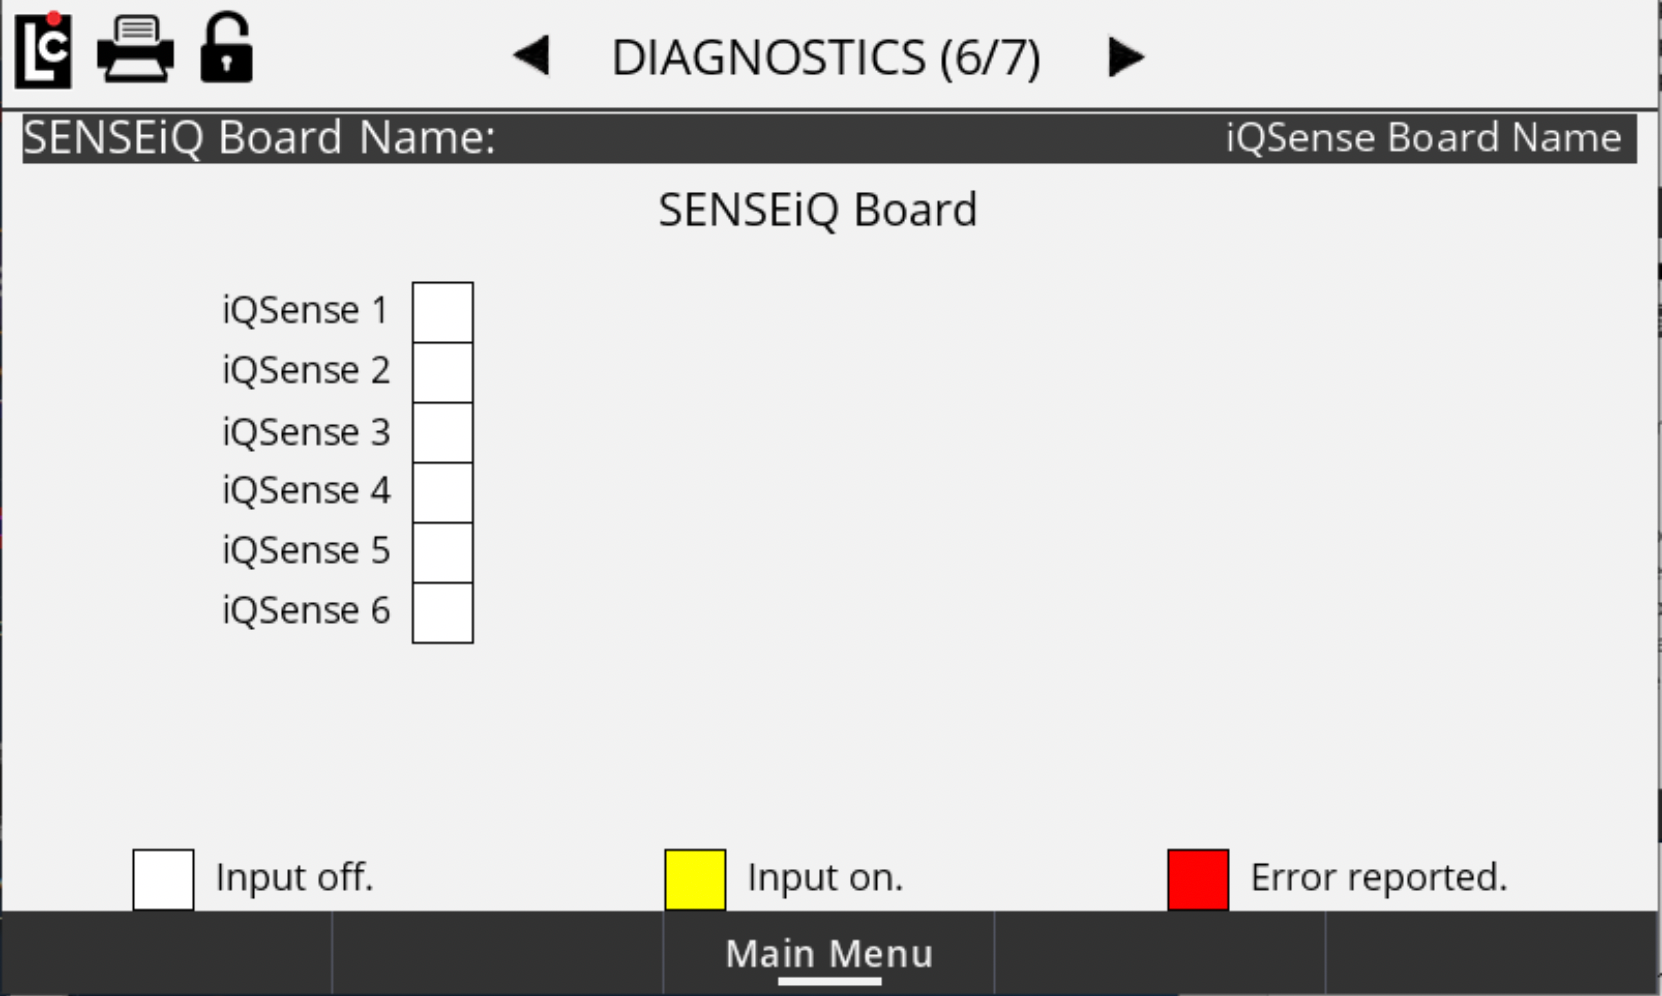
Diagnostics Screen 6/7
This screen monitors status of up to 6 SENSEiQ expansion boards (if installed).
Diagnostics Screen 7/7
Message Logging is a tool within the register that allows a user to pull log files from the register and display, print, and export diagnostic information.
The Message, Smart Pump, and Water Detector logs are viewable and configurable Diagnostics (6/6) screen. However, these settings cannot be changed when the register is unlocked. For both the Smart Pump and Water Detector, the corresponding Services also need to be enabled.
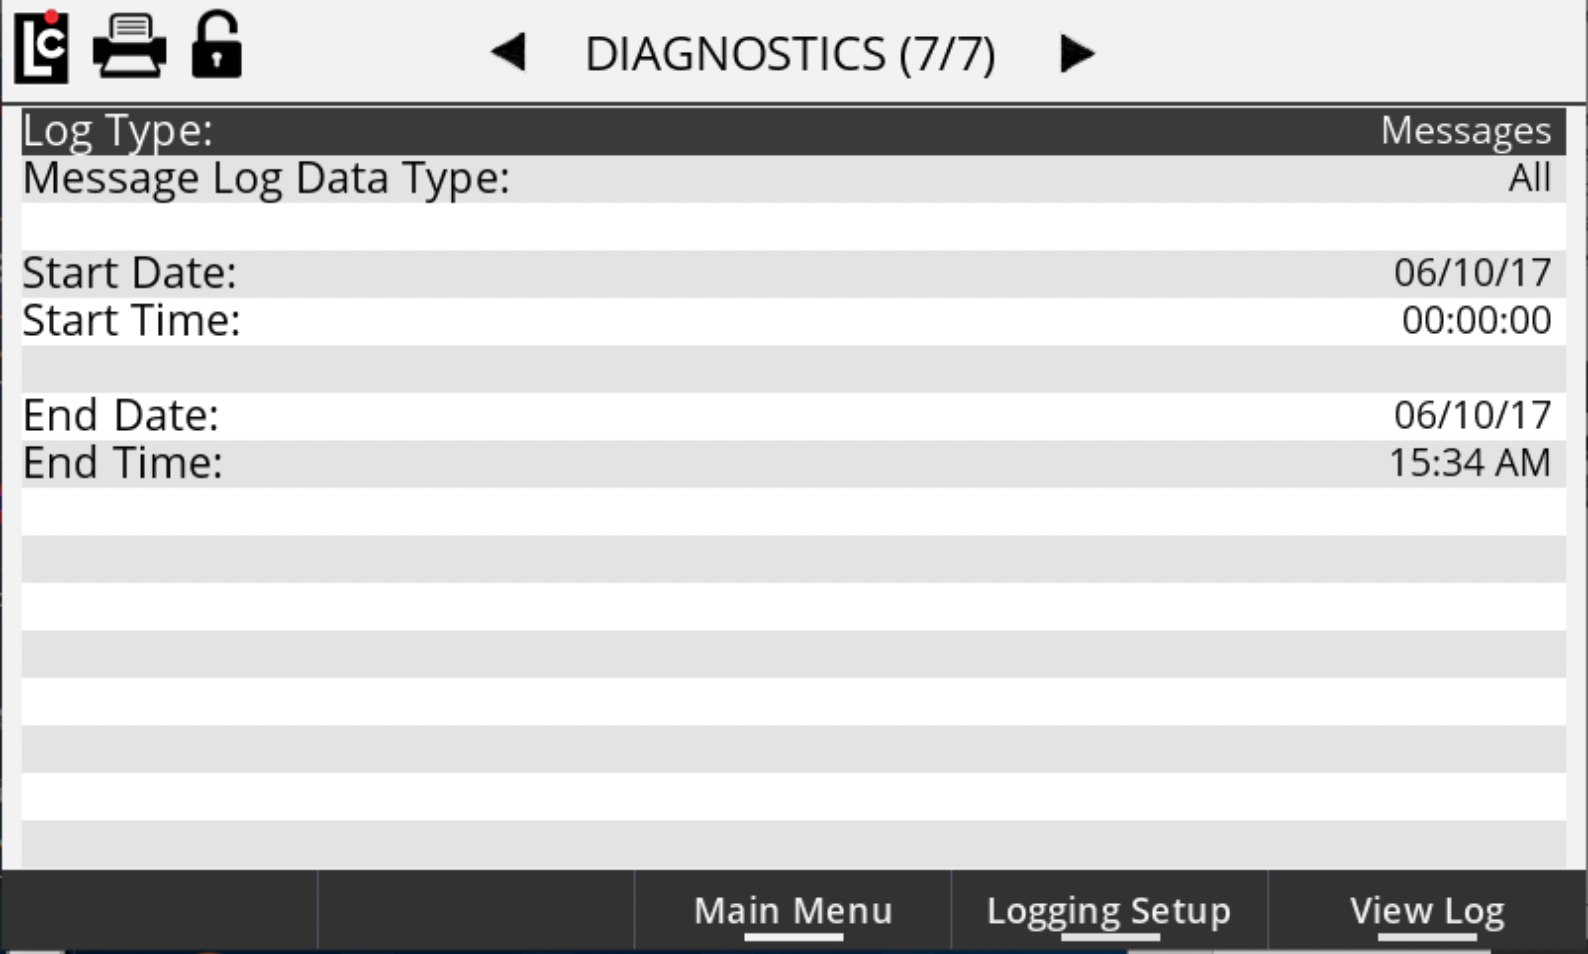
Log Type
A list box that can be used to select a data log that can be viewed on-screen and also printed. Upon selecting Log Type, a drop-down menu appears and provides the following log file types you can view.
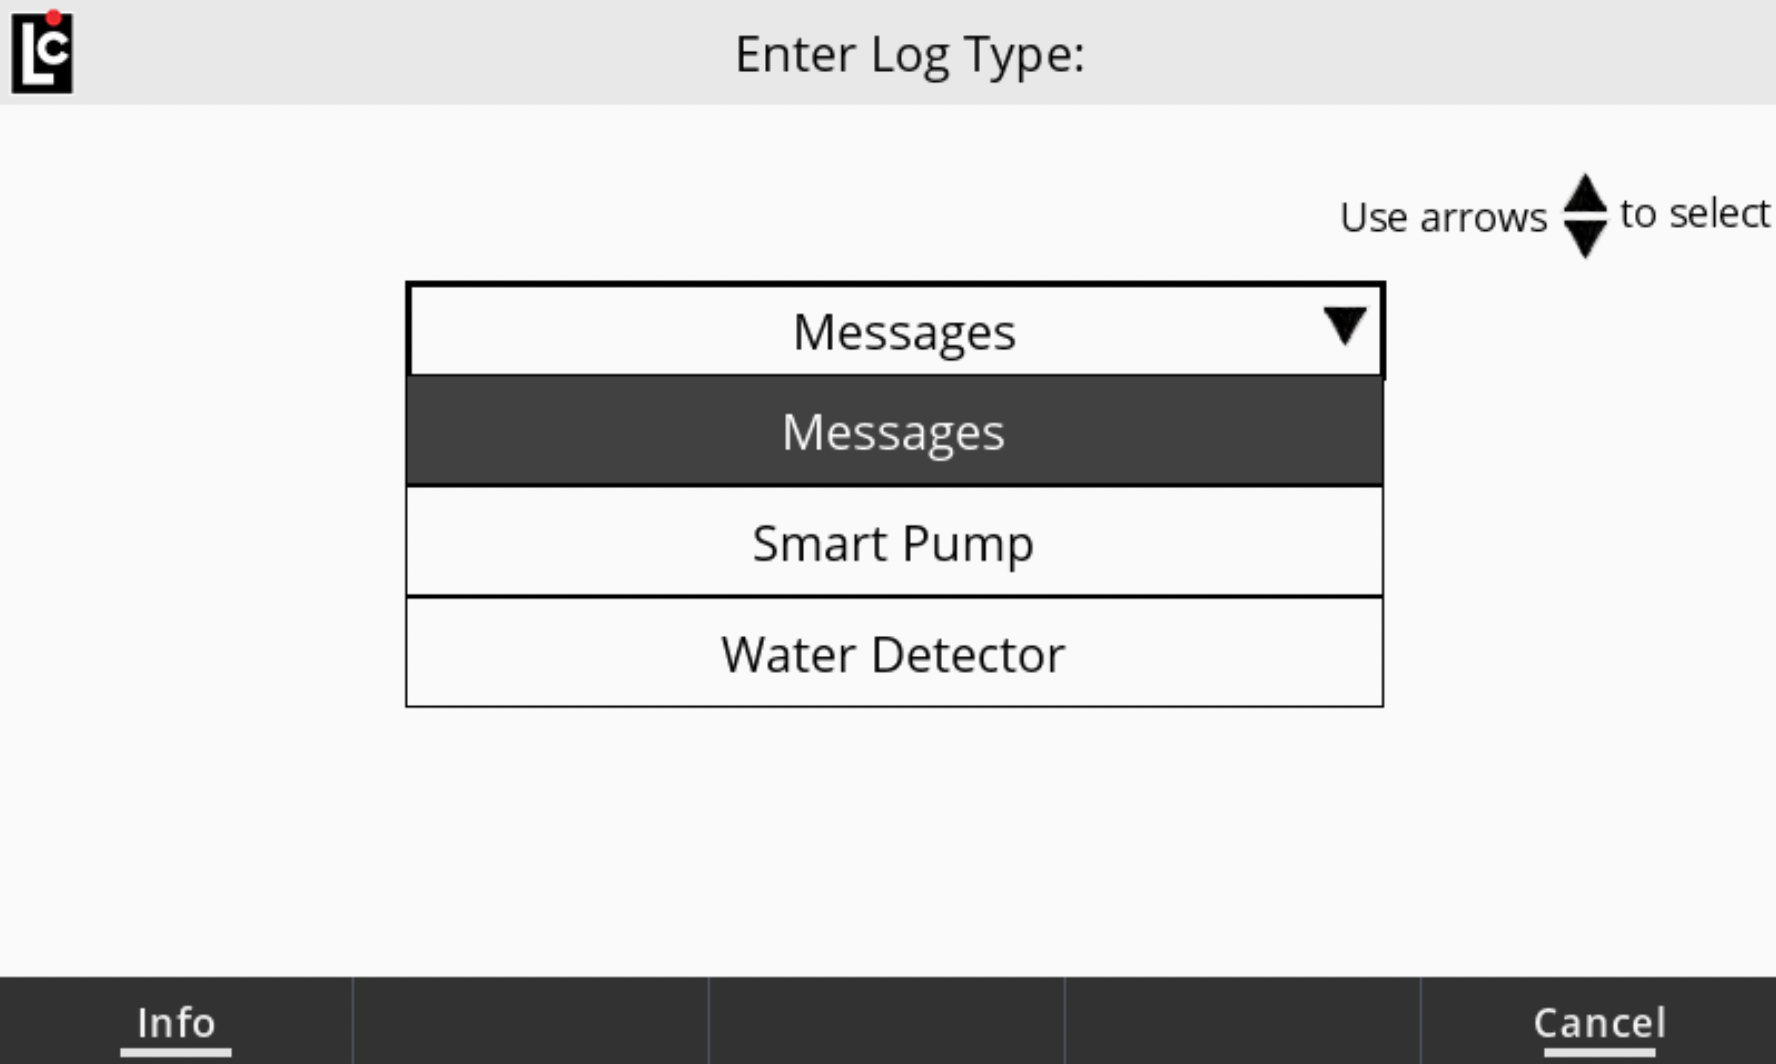
Log Types include the following: Messages, Smart Pump, and Water Detector. To view the Smart Pump and Water Detector log types, the corresponding Services must be enabled, and the logs enabled in Logging Setup (1/2).
If Messages is selected for the Log Type, you can select a subtype of data specific to the Message Log, and alaos choose the date range to include in the view.
Message Log Data Types include the following subtypes of data: All, Calibration, Errors, Flow Start/End, Hardware Diagnostics, LCP Diagnostics, Operator Actions, Parameter Changes, Shift Start/End, Software Diagnostics, and Warnings.
Start Date/Time and End Date/Time allows you to limit the range of data for the Message Log that you would like to view.
Once a log type is selected, press the function key View Logs to display the logs on the screen. Once the log is viewable on the screen, you can press the function key Print to print the log (if a printer is installed).
To change the data that is saved to the logs, press the Logging Setup function key.
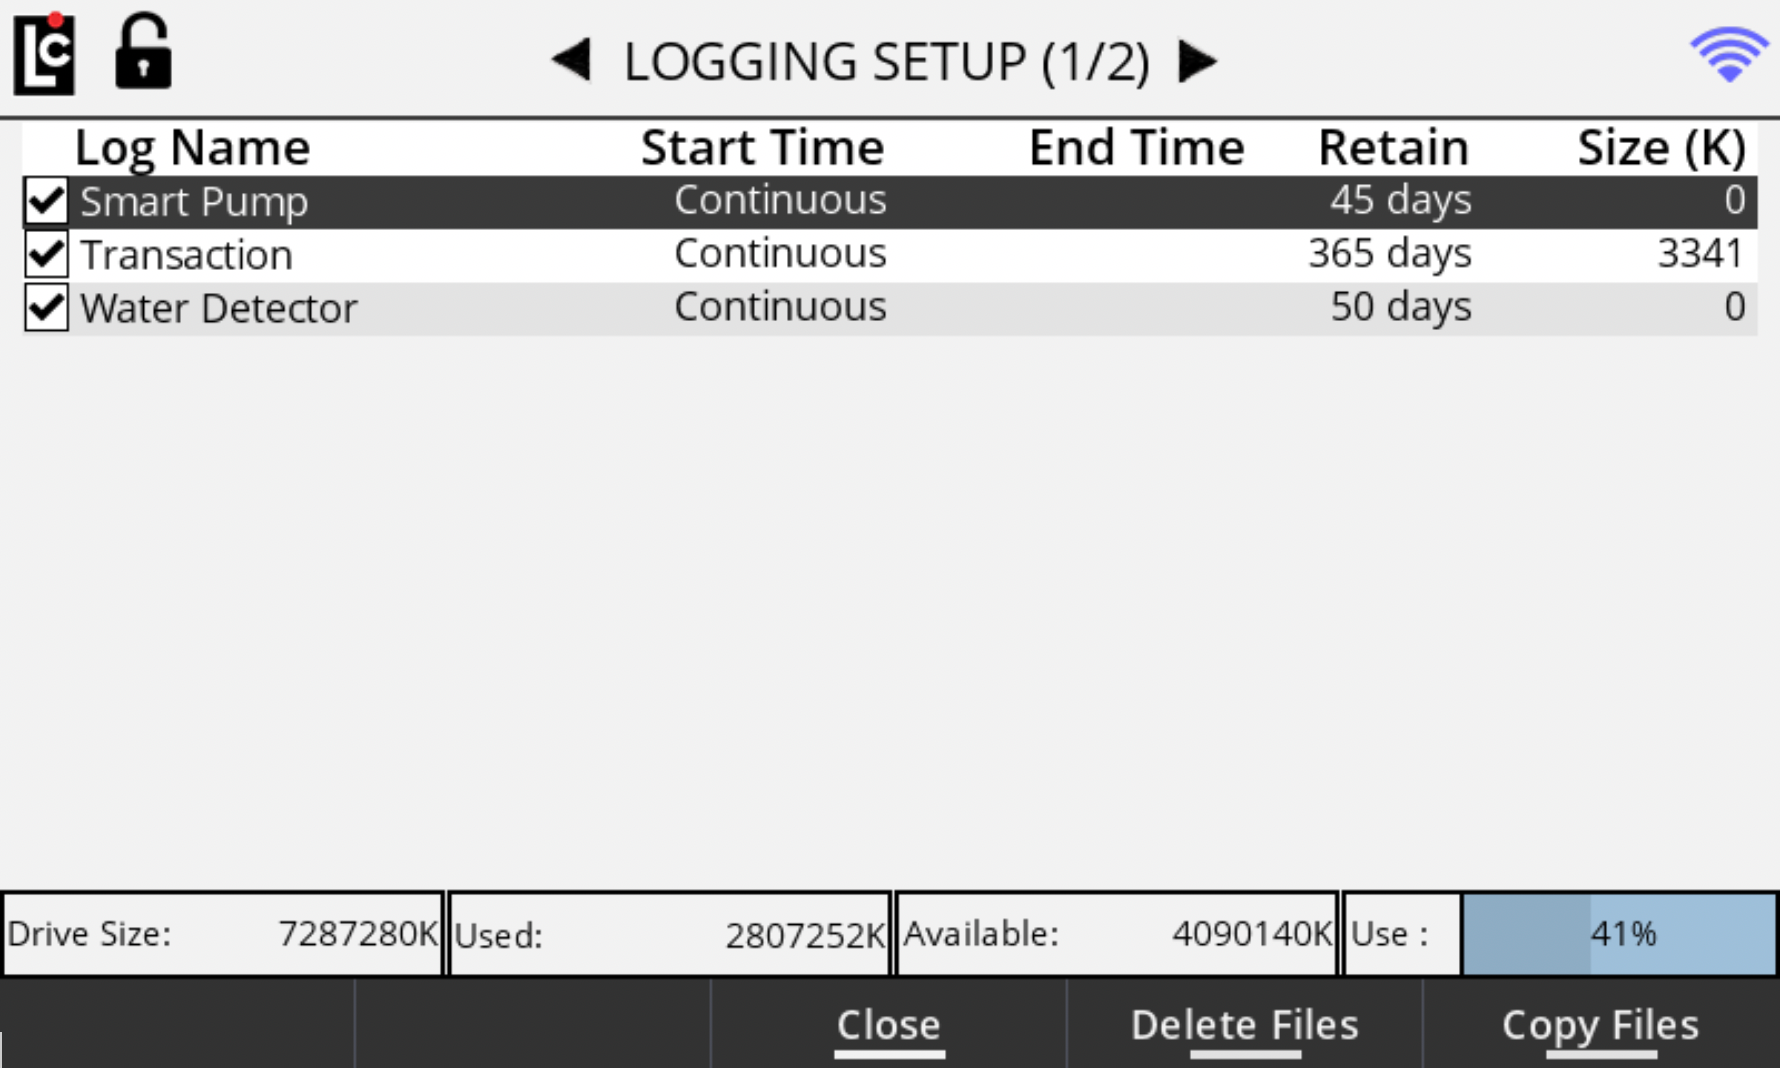
Logging Setup Screens
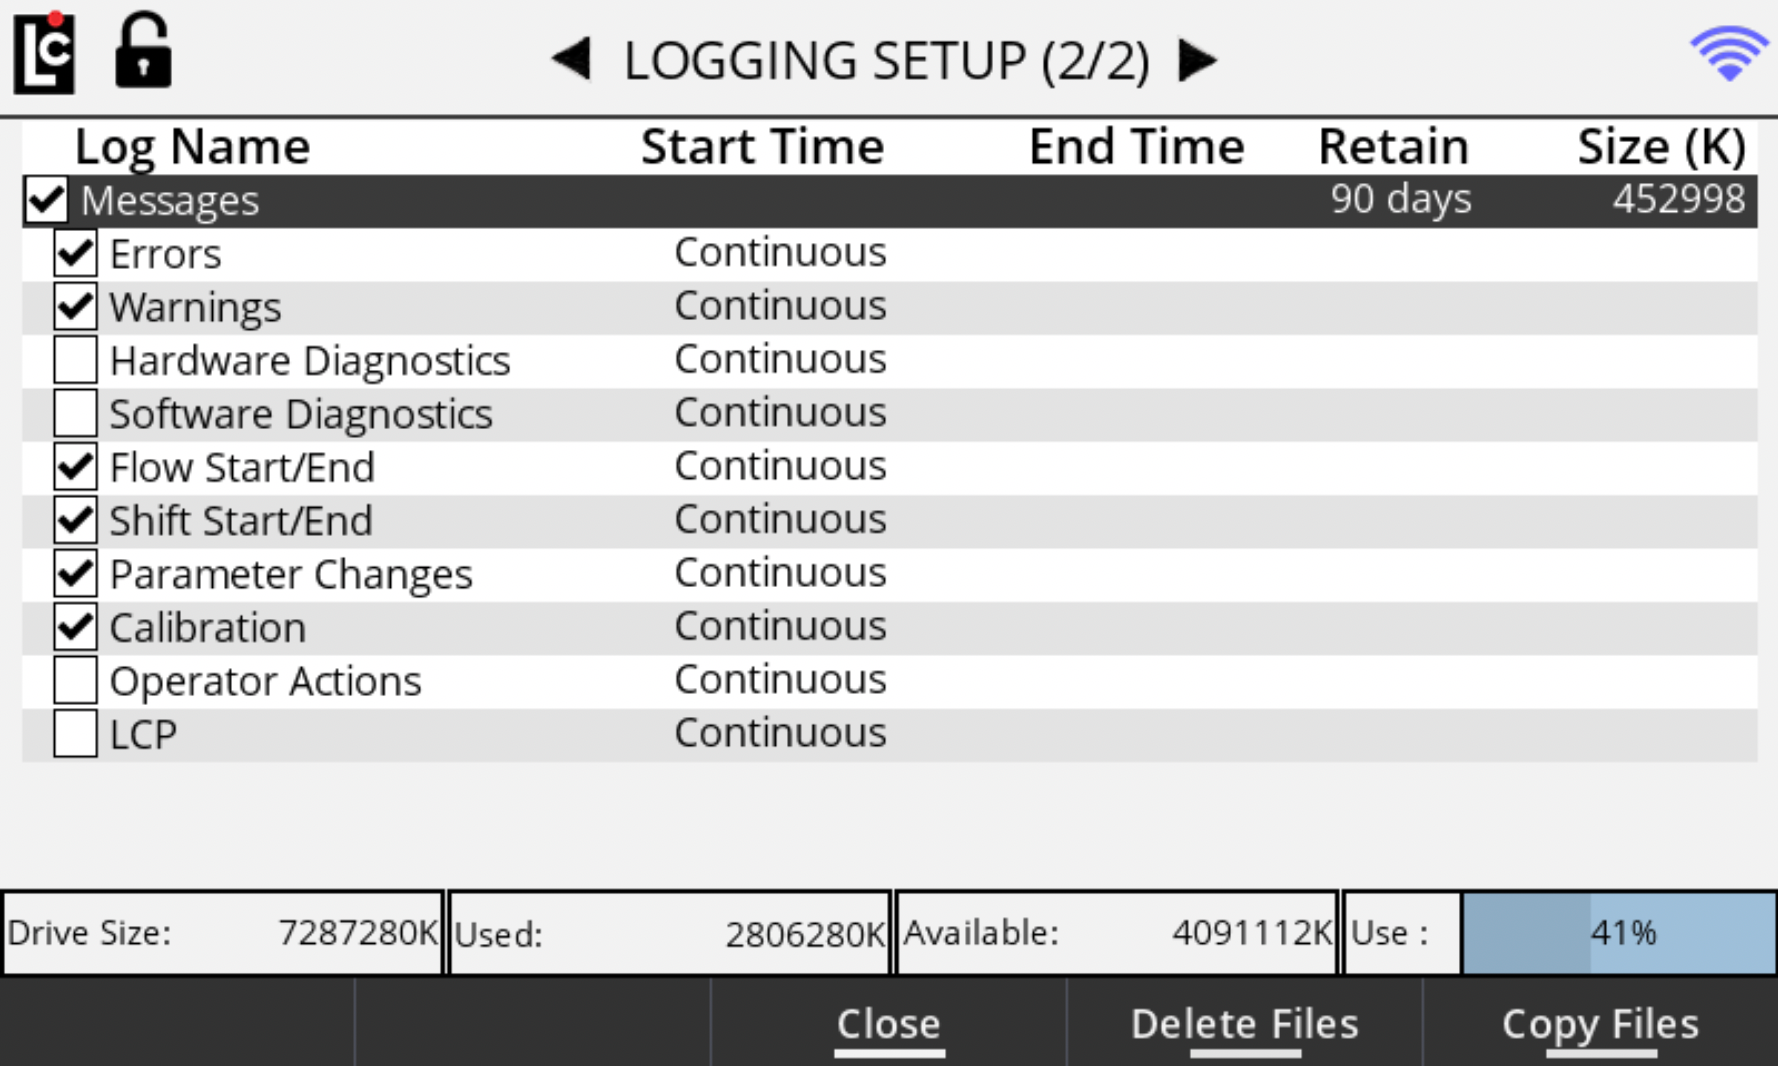
You cannot modify the settings on this screen if the register is locked. The Smart Pump, Transaction, and Water Detector Logs can be enabled and disabled on the first screen, and Message Log data subtypes can be enabled and disabled on the second screen. A log has been enabled if a check mark appears before its name. Both the Smart Pump and Water Detector logs that you enable the corresponding Service.
To enable/disable a log, use the arrow keys to navigate to the desired line and then press Enter. Next, select Continuous or Specific for Enter Log Start Date/Time. If you select Continuous, enter the Log Retain Time–which is the number of days to retain the log data. If you select Specific, enter the Log Start Date and sthe Log End Date.
WARNING: If you enable all of the Message Log subtypes, the register will continue to store a lot of data– especially if you also enable Hardware Diagnostics, Software Diagnostics, and Operator Actions. We recommend that if you enable all of these options that you either (a) set a Specific End Time or (b) set the Retain value to a low number of days. |
If the Weights & Measures seal screw has been removed, you may use the Delete Files function key to delete existing log files–or use the Copy Files function key to copy existing log files to a USB drive.